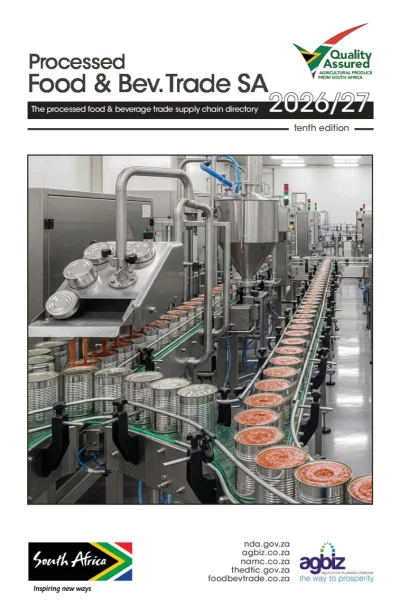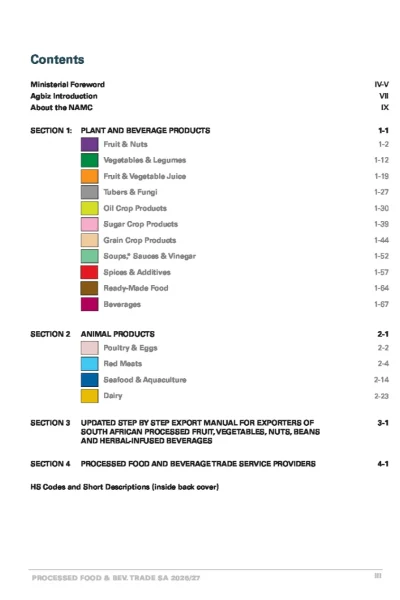
Register to receive a free download link via your email address
We respect your privacy, do not tolerate spam and will never sell or give away your personal information to any third party.
South Africa’s food and beverage industry spans everything from farm inputs and primary production through processing, packaging, cold chain and distribution to retail shelves, foodservice kitchens and export markets. It is one of the country’s largest manufacturing blocks and one of its most consistent export earners. This page explains how the sector is put together, which segments sit inside it, how the value chain connects, and what the current manufacturing, trade and regulatory picture looks like.
Last reviewed: September 2026. Every statistic below states its reference period and its source.
Manufacturing figures describe the food and beverages division as Statistics South Africa defines it. That division sits inside manufacturing and excludes primary agriculture, wholesale, retail and foodservice.
| Indicator | Latest figure | Reference period | Source |
|---|---|---|---|
| Weight of food and beverages in the manufacturing production index | 22.19 per cent, the second largest of ten divisions | Index weights applied in the June 2026 release | Stats SA, Manufacturing: production and sales (P3041.2) |
| Food and beverages manufacturing sales | R70 524 million for the month | June 2026 | Stats SA, P3041.2 |
| Food and beverages share of total manufacturing sales | 24.4 per cent of the R289 224 million monthly total, derived by dividing the two published figures | June 2026 | Derived from Stats SA, P3041.2 |
| Food and beverages production, year on year | Down 3.9 per cent, contributing minus 1.0 percentage point to the total manufacturing change | June 2026 against June 2025 | Stats SA, P3041.2 |
| Total manufacturing production, year on year | Down 1.7 per cent | June 2026 against June 2025 | Stats SA, P3041.2 |
| Employees in food and beverage manufacturing | 186 685, down 1.2 per cent from 188 896 the previous year | 2023 | FoodBev Manufacturing SETA, Sector Skills Plan 2024/25 |
| Entities registered in the sector | 16 720 registered employer entities, of which 4 188 paid the skills development levy | 2023 registrations, 2022 levy year | FoodBev SETA SSP 2024/25, using SARS employer data |
| Share of employers with fewer than 50 employees | 87.3 per cent | 2023 | FoodBev SETA SSP 2024/25 |
| Agricultural exports | US$15.1 billion, up 10 per cent year on year, with an agricultural trade surplus of US$7.3 billion | Full year 2025 | Agbiz analysis, reported February 2026 |
| PPECB export certificates issued | 285 787 certificates, covering more than 360 million cartons and 330 million kilograms | Financial year to 31 March 2025 | PPECB Annual Report 2024/25 |
| Foodservice industry income | R9 277.2 million for the month, up 8.4 per cent in nominal terms and 1.0 per cent in real terms | June 2026 | Stats SA, Food and beverages (P6420) |
How to read this. Manufacturing output contracted in mid-2026 while agricultural exports set a record for 2025 and foodservice income grew in nominal terms. Those are three different parts of the same industry, measured on different bases. Volume-driven export categories and demand-driven prepared food categories do not move together, and a single headline number for the industry hides more than it reveals.
The phrase is used loosely. For any practical decision, split it into five layers, because each layer has different regulators, different buyers and different sourcing logic.
Agriculture and primary production. Growing, harvesting, fishing, aquaculture and livestock. Regulated mainly through the Department of Agriculture. Not counted as manufacturing in the national statistics, which is why agricultural output and food manufacturing output can move in opposite directions in the same quarter.
Processing and manufacturing, or agro-processing. Turning primary and intermediate material into products for sale. The Department of Trade, Industry and Competition describes agro-processing as the manufacturing sub-sector that beneficiates primary materials and intermediate goods from agricultural, fisheries and forestry-based sectors. This layer covers meat, fish, fruit and vegetable processing, dairy, grain milling and bakery, oils and fats, prepared and preserved foods, and beverages. It is what Stats SA counts as the food and beverages division. Read more on agro-processing and food manufacturing in South Africa.
Wholesale and distribution. Wholesalers, distributors, agents, market agents on the fresh produce markets, and importers. This layer decides which products physically reach which regions and at what landed cost.
Retail and foodservice. Supermarket groups, independent retail, forecourt and convenience, wholesale-retail hybrids, restaurants, take-away and fast-food outlets, catering and institutional feeding. Stats SA measures the foodservice part separately from manufacturing and from retail trade.
Support services. Packaging converters, ingredient suppliers, equipment and engineering, cold storage and logistics, laboratories, certification bodies, compliance consultants, freight forwarding and customs services, and financing. This layer rarely appears in industry headlines but it determines whether a supplier can actually meet a buyer’s requirements.
A useful working rule: if a business changes the physical form of food, it sits in layer two and is regulated as a manufacturer. If it only moves, stores or sells food, it sits in layers three or four and is regulated primarily on hygiene, cold chain and labelling accuracy.
Read this as a sequence of handovers. Most commercial disputes and most compliance failures happen at a handover, not inside a stage.
| Stage | Who operates here | Risk at the handover |
|---|---|---|
| 1. Inputs | Seed, feed, fertiliser, agrochemicals, veterinary products, water, energy, packaging substrates, ingredients and additives | Input traceability and residue history, which a buyer will ask about years later |
| 2. Primary production | Farms, orchards, vineyards, feedlots, dairies, fishing and aquaculture operations | Farm-level assurance evidence and harvest records |
| 3. First handling and aggregation | Packhouses, silos, market agents, co-operatives, dairy collection, abattoirs, primary processing | Lot identity. If lots are merged here without records, downstream recall capability is lost |
| 4. Processing and manufacturing | Own-brand manufacturers, private-label manufacturers, co-packers and contract manufacturers | Specification control and allergen management between the brand owner and the co-packer |
| 5. Packaging and labelling | Primary and secondary packaging, artwork, coding, date marking, market-specific label variants | The label itself. Incorrect or non-compliant labels are among the most common reasons a listing or a shipment is delayed |
| 6. Storage and logistics | Ambient and cold storage, food-grade warehousing, refrigerated road transport, rail, sea freight, airfreight for high-value perishables | Temperature continuity and the documentary proof of it |
| 7. Wholesale and distribution | Distributors, wholesalers, importers, market agents | Stock rotation, shelf life remaining on delivery, and returns terms |
| 8. Retail, foodservice and export buyer | Retail listings, foodservice contracts, institutional supply, export customers reached directly or through an importer | Buyer-specific compliance requirements that exceed the legal minimum |
Running across every stage: food safety management, traceability records, laboratory testing, certification and audit, and customs and export documentation where the product leaves the country. Practical detail on the handovers that cause the most trouble is covered in the co-packer selection questions to ask before you sign, the food label compliance checklist for SA retail listings, the comparison of cold storage versus ambient warehousing for food-grade stock, and the traceability minimum standard SA buyers expect. For a wider view of how the SA food supply chain fits together, start there.
Two authoritative classifications are worth knowing, because buyers, funders and regulators use them.
Statistics South Africa groups food and beverages as one of ten manufacturing divisions in the manufacturing production and sales series. At the index weights applied in the June 2026 release, food and beverages carries 22.19 per cent of the manufacturing index, second only to petroleum, chemical products, rubber and plastic products at 23.91 per cent. That places food and beverages among the two largest blocks of South African manufacturing on either an output or a sales basis.
FoodBev Manufacturing SETA, the statutory skills authority for the sector, divides it into five chambers. The distribution below is from the Sector Skills Plan 2024/25 and describes 2023.
| Chamber | Share of employers, 2023 |
|---|---|
| Food preparation products, including flour, spices, cocoa, condiments and pasta | 49.6 per cent |
| Production, processing and preservation of meat, fish, fruit, vegetables, oils and fats | 28.7 per cent |
| Manufacture of beverages, including spirits, beer, malt, soft drinks and mineral water | 13.9 per cent |
| Manufacture of dairy products | 7.0 per cent |
| Manufacture of breakfast products | 0.8 per cent |
Where the sector sits geographically. On the same 2023 data, the Western Cape hosts about 37 per cent of registered employers and Gauteng about 31 per cent, with KwaZulu-Natal at about 12 per cent. On employment the picture flattens out, with Gauteng and the Western Cape at roughly 35 per cent each and KwaZulu-Natal at about 12 per cent. In plain terms, the Western Cape has more firms and Gauteng has larger ones.
Firm size matters more than most industry commentary allows. On the 2023 data, 87.3 per cent of employers in the sector have fewer than 50 employees. A sourcing strategy built only around the large listed manufacturers will miss most of the supply base.
Wine as a distinct segment. Wine sits inside beverage manufacturing statistically but operates under its own certification regime and its own tourism economy. On SAWIS data published by Wines of South Africa, 2 255 primary grape producers and 508 wine cellars that crush grapes were recorded for 2024, both on a long-term declining trend since 2011. Consolidation at cellar level is the structural story to watch. The South African wineries directory covers the producer side.
Manufacturing is under pressure. In June 2026 total manufacturing production fell 1.7 per cent against June 2025, and the food and beverages division fell 3.9 per cent, contributing minus 1.0 percentage point to the total. Food and beverages was one of the main drivers of the overall decline. Seasonally adjusted manufacturing production fell 1.5 per cent in the second quarter of 2026 against the first quarter, with seven of the ten divisions negative over the three months to June 2026.
Trade is doing better than manufacturing. South African agricultural exports reached a record US$15.1 billion in 2025, up 10 per cent on 2024, with an agricultural trade surplus of US$7.3 billion, up 18 per cent. Leading export categories included citrus, table grapes, maize, nuts, apples and pears, wine, sugar and fruit juices. Regional shares moved through the year. On the fourth-quarter 2025 split, Africa took 53 per cent, Asia and the Middle East 17 per cent, the European Union 16 per cent, the United Kingdom and rest of world 10 per cent, and the Americas 4 per cent. Read these as quarterly shares rather than annual ones. They shift with each commodity’s season.
The export machine is measurable. In the 2024/25 financial year the Perishable Products Export Control Board processed 285 787 export certificates nationally, a 23 per cent increase on the previous year, covering more than 360 million cartons and 330 million kilograms. Inspection volumes for that year included 171.5 million cartons of citrus, 69.7 million cartons of table grapes, 61.9 million cartons of pome fruit, 23.0 million cartons of stone fruit and 19.5 million cartons of avocados. Table grape exports for that season went 60 per cent to the European Union, 20 per cent to the United Kingdom and 8 per cent to North America.
Domestic demand for prepared food is growing in nominal terms only. Stats SA recorded R9 277.2 million of income in the food and beverages foodservice industry in June 2026, up 8.4 per cent on June 2025 in current prices but only 1.0 per cent at constant 2019 prices. The gap between those two numbers is the practical point: consumers are spending more rand for close to the same volume.
What this combination means for a sourcing or investment decision. Export-facing horticulture and its supporting cold chain are growing. Domestic-facing manufacturing volume is not. A supplier whose business case rests on domestic volume growth should be asked how it is holding margin. A supplier whose case rests on export growth should be asked about its certification depth and its port exposure.
The support ecosystem is where most sourcing decisions are actually made. Five groups matter.
Manufacturing and co-packing capacity. Own-brand manufacturers, private-label specialists, and co-packers who run someone else’s formulation. The choice between building capacity and using a co-packer usually comes down to volume certainty, minimum run sizes and how much formulation control the brand owner needs to keep. Start with the list of food processing companies in South Africa, then narrow by category using processed food suppliers by category or beverage manufacturing companies and co-packers.
Packaging and labelling. Substrate converters, closures, printing, artwork and coding. Packaging decisions carry compliance consequences, because the label is the legal statement about the product and it must satisfy the destination market, not only the market of origin.
Storage and logistics. Food-grade ambient warehousing, cold and frozen storage, refrigerated road transport, container and conventional sea freight, and airfreight for high-value perishables. Ask for the temperature record, not the temperature promise. Context on the local picture is in food logistics in South Africa: cold chain and last mile.
Laboratories and testing. Microbiological testing, chemical and residue analysis, nutritional analysis for labelling, shelf-life studies and water testing. Accreditation status is the thing to check. SANAS accreditation to ISO/IEC 17025 is the recognised marker for testing laboratories in South Africa. Plan the work using shelf-life planning and testing for SA manufacturers and residue and quality testing without over-testing.
Certification, audit and advisory. Certification bodies for the recognised food safety schemes, auditors, and consultants who prepare a plant for audit. A certificate issued by an accredited body against a recognised scheme is worth materially more to a buyer than an unverified self-declaration. Which scheme to pursue is covered in FSSC 22000 vs BRCGS vs ISO 22000 by buyer channel.
A practical sequencing note for suppliers. Compliance evidence, not marketing material, is what shortens a buyer’s evaluation. The usual order is hygiene and premises compliance first, then product specification and labelling, then a recognised food safety certification if the buyer channel requires one, then export documentation if the product is leaving the country.
Four distinctions matter, and mixing them up is expensive.
| Instrument | Administered by | What it governs |
|---|---|---|
| Foodstuffs, Cosmetics and Disinfectants Act 54 of 1972 | National Department of Health | The framework law for food safety, composition, labelling and hygiene. Most food regulations are made under it. |
| Regulations R.638 of 2018, Government Gazette 41730 of 22 June 2018, under Act 54 of 1972 | National Department of Health, enforced by municipal environmental health | General hygiene requirements for food premises, the transport of food and related matters. This is the source of the Certificate of Acceptability requirement. |
| Regulations R.146 of 2010, under Act 54 of 1972 | National Department of Health | Labelling and advertising of foodstuffs. This remains the operative labelling regulation. |
| Agricultural Product Standards Act 119 of 1990 | Department of Agriculture | Quality standards and grading for regulated agricultural products, including products intended for export. |
| Perishable Products Export Control Act 9 of 1983 | PPECB, as a national public entity | Cold chain services for perishable exports. The PPECB also performs inspection and food safety services assigned to it by the Department of Agriculture under the Agricultural Product Standards Act. |
| Meat Safety Act 40 of 2000 | Department of Agriculture | Meat safety, national standards for abattoirs, and the import and export of meat. |
| Liquor Products Act 60 of 1989 | Department of Agriculture | Wine, spirits and other liquor products, including the Wine of Origin scheme and export certification for these products. |
| Compulsory specifications administered by the NRCS | National Regulator for Compulsory Specifications | Specific product categories including canned fish, marine molluscs and crustaceans, frozen fish, frozen shrimps, prawns and crabs, canned and processed meat products, smoked snoek, and live and aquacultured shellfish. The NRCS also issues health guarantees for exports and compliance certificates for imports. |
| Customs and excise registration and declaration requirements | SARS | Registration as an importer or exporter, customs declarations, and clearance through designated ports. Certain goods require an export permit produced at the time of clearance. |
Draft regulations R.3337 on the labelling and advertising of foodstuffs were published for comment in April 2023 and introduce mandatory front-of-pack warning labels for products above set thresholds, together with restrictions on claims and endorsement logos. As at July 2026 they remained a draft under departmental review, with no published transition period and no official public update on timing. Until a final version is gazetted, R.146 of 2010 governs. Preparing artwork for R.3337 now is a commercial risk decision, not a compliance obligation, and the draft may change before it is finalised.
FSSC 22000, BRCGS and ISO 22000 for manufacturing. GLOBALG.A.P. and SIZA and sustainable agriculture assurance in South Africa at farm level. HACCP as the underlying methodology in most of them. None of these is South African law. Retailers, importers and international buyers make them a condition of supply, which is why a supplier may need a certificate the law does not demand. Which scheme fits depends on the buyer channel, not on which scheme is best regarded in general.
Regulatory positions change. Verify the current status of any regulation with the National Department of Health food control pages or the relevant department before acting on it.
Kept short and tied to evidence. This is not a forecast.
Pressure: manufacturing volume. Food and beverages production fell 3.9 per cent year on year in June 2026, against a total manufacturing decline of 1.7 per cent, making it one of the main contributors to the overall fall. Volume-based business cases in domestic manufacturing need testing against this.
Pressure: sector employment. Food and beverage manufacturing employment was recorded at 186 685 in 2023, down 1.2 per cent on the previous year, which the FoodBev SETA Sector Skills Plan attributed to electricity supply conditions and automation. That is a 2023 observation and should be refreshed against the next Sector Skills Plan.
Pressure: nominal growth outrunning real growth. Foodservice income rose 8.4 per cent in current prices but 1.0 per cent in constant prices in June 2026. Categories exposed to household discretionary spend are absorbing cost rather than expanding volume.
Opportunity: export horticulture and its supply chain. Agricultural exports set a record US$15.1 billion in 2025 with a US$7.3 billion surplus, and PPECB export certificates rose 23 per cent in 2024/25. Growth is concentrated in perishables, which pulls demand through packhouses, cold storage, refrigerated transport, testing and certification.
Opportunity: market access work is still opening doors. The Philippine market formally opened to South African table grapes on 26 February 2025, concluding a negotiation begun in January 2015. New market access continues to be won product by product, and it favours suppliers whose compliance documentation is already in order.
Opportunity: digital export documentation. The PPECB reported a 51 per cent increase in electronic export certificates processed on its TITAN 2.0 platform in 2024/25, with 343 million cartons, or 95 per cent of all fruit products, inspected on the platform across 1 086 activity points. Exporters and packhouses still on paper-based processes are working against the direction of the system.
A note on concentration risk. PPECB reported below-budget export volumes in 2024/25 for citrus, table grapes, pome fruit, stone fruit, groundnuts, canning and maize and grain, alongside above-budget volumes for dried fruit, tree nuts, avocados, vegetables, flowers and mangoes. Category performance diverges sharply within the same season. Portfolio decisions should be made at category level, not at sector level.
For consumer-facing trend commentary, see South African food industry trends and insights. This overview deliberately keeps trends subordinate to structure.
Pick the route that matches the decision in front of you.
Sourcing a manufacturer or processor. Start with the food processing companies in South Africa list, then narrow by category. If the product is someone else’s formulation, work through the co-packer questions before signing.
Vetting a specific supplier. Use the ten questions South African buyers ask first, then confirm which food safety certification the buyer channel actually requires.
Moving or storing product. Read the food logistics overview and settle the storage question before committing to a lane.
Planning an export. Decide the route to market for export: distributor, importer or direct buyer, then work through export labelling and pack requirements, and register with SARS as an exporter before committing to a shipping date.
Looking for fresh produce or wine specifically. The fresh food service providers directory covers the fresh side and the wineries listing covers wine and wine tourism.
Wanting the whole picture in one place. The food trade directory South Africa and the three annual guides below map the supply chain by sector.
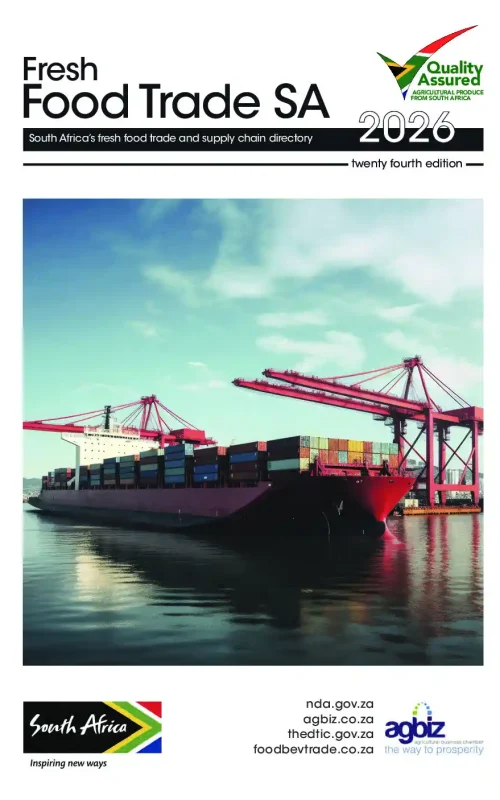
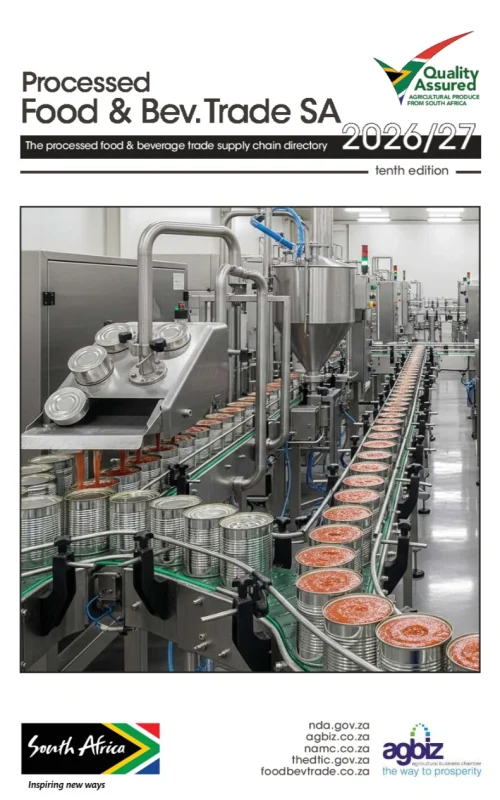
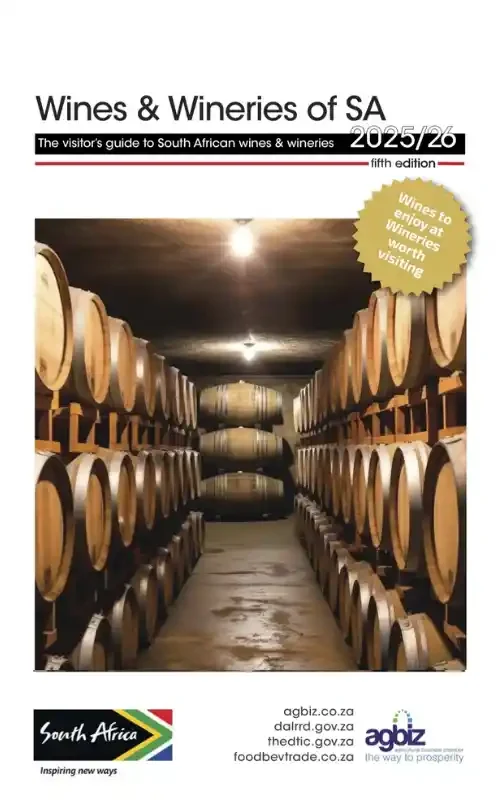
Food & Beverage Trade South Africa publishes three annual guides. Each one maps a part of the supply chain and lists the companies operating in it, with contact details. Choose the guide that matches your sector. The download link is emailed to the address you enter, usually within a few minutes.
Registering a business submits it for consideration in a future edition. It does not guarantee inclusion. Your details are handled in line with our Privacy Policy and are not sold or shared with third parties for their own marketing.
It covers five connected layers: agriculture and primary production; processing and manufacturing, often called agro-processing; wholesale and distribution; retail and foodservice; and the support services that serve all of them, including packaging, logistics, laboratories and certification. National manufacturing statistics count only the processing and manufacturing layer as the food and beverages division.
On the index weights applied in the June 2026 Stats SA release, food and beverages carries 22.19 per cent of the manufacturing production index, the second largest of ten divisions. Sales for the division were R70 524 million in June 2026, out of R289 224 million for total manufacturing.
The FoodBev Manufacturing SETA Sector Skills Plan 2024/25 recorded 186 685 employees in food and beverage manufacturing in 2023, down 1.2 per cent on 2022. Figures for later years will appear in subsequent Sector Skills Plans.
The National Department of Health administers the Foodstuffs, Cosmetics and Disinfectants Act 54 of 1972 and the regulations made under it, including hygiene requirements under R.638 of 2018 and labelling under R.146 of 2010. Municipal environmental health practitioners enforce premises hygiene and issue Certificates of Acceptability. The Department of Agriculture administers product standards, meat safety and liquor products. The NRCS administers compulsory specifications for defined product categories, and SARS handles customs registration and declarations.
Not as a matter of law. These are voluntary schemes. Many retailers, importers and export buyers require one of them as a condition of supply, so in practice the requirement comes from the buyer rather than the regulator. Which scheme to pursue depends on the buyer channel you are targeting.
At minimum: registration with SARS as an exporter, a customs declaration for each consignment, any export permit the product category requires, labelling that meets the destination market’s rules, and, for regulated perishables, PPECB inspection and export certification. Buyer-specific certification requirements sit on top of these.
On agricultural trade, yes in recent years. Agbiz reported record agricultural exports of US$15.1 billion in 2025 with an agricultural trade surplus of US$7.3 billion. Note that agricultural trade and food and beverage manufacturing are different measures covering different goods.
The company lists on this site cover food processing companies, processed food suppliers, beverage manufacturers, fresh food service providers and South African wineries. The annual trade guides cover the same ground in more depth and are free to download. Verifying any supplier before contracting remains your responsibility.
Statistics South Africa, Manufacturing: production and sales, June 2026 (P3041.2). Statistics South Africa, Food and beverages, June 2026 (P6420). FoodBev Manufacturing SETA, Sector Skills Plan 2024/25. Department of Trade, Industry and Competition, Agro-processing. PPECB, Legal and regulatory compliance and Annual Report 2024/25 operations report. National Department of Health, food control regulations. SARS, exports. NRCS, food and associated industries. Wines of South Africa, SA wine industry statistics. Agricultural export figures from Agbiz analysis as reported in February 2026.
Supplier due diligence remains the buyer’s responsibility. Inclusion in a Food & Beverage Trade South Africa publication or on this website is not approval, certification, endorsement or a warranty of any company’s compliance status, capability or financial standing. Verify certification, licensing and compliance directly with the supplier and with the relevant issuing body.
Food & Beverage Trade South Africa is a trade publisher and connector. Registering a business submits it for consideration for a future edition. It does not guarantee inclusion, and it is not an endorsement, a certification, a listing on this website, or a commitment to provide leads or enquiries.
Last reviewed: September 2026.
Related: Food Processing Companies in South Africa | Fresh Food Service Providers | Processed Food Suppliers | Beverage Manufacturing Companies | South African Wineries | Food Trade Directory South Africa
We respect your privacy, do not tolerate spam and will never sell or give away your personal information to any third party.
We respect your privacy and do not tolerate spam and will never sell, rent, lease or give away your information (name, address, email, etc.) to any third party.
We respect your privacy, do not tolerate spam and will never sell or give away your personal information to any third party.
We respect your privacy, do not tolerate spam and will never sell or give away your personal information to any third party.
Feature now in the online edition and also in the next print edition. After registration you will receive an email with detailed participation options.
We respect your privacy and do not tolerate spam and will never sell, rent, lease or give away your information (name, address, email, etc.) to any third party.
We respect your privacy, do not tolerate spam and will never sell or give away your personal information to any third party.
We respect your privacy, do not tolerate spam and will never sell or give away your personal information to any third party.
Feature now in the online edition and also in the next print edition. After registration you will receive an email with detailed participation options.
We respect your privacy and do not tolerate spam and will never sell, rent, lease or give away your information (name, address, email, etc.) to any third party.

Register to receive a free download link via your email address.
We respect your privacy, do not tolerate spam and will never sell or give away your personal information to any third party.
Register to receive a free download link via your email address.
We respect your privacy, do not tolerate spam and will never sell or give away your personal information to any third party.
We respect your privacy and do not tolerate spam and will never sell, rent, lease or give away your information (name, address, email, etc.) to any third party.
We respect your privacy and do not tolerate spam and will never sell, rent, lease or give away your information (name, address, email, etc.) to any third party.
We respect your privacy and do not tolerate spam and will never sell, rent, lease or give away your information (name, address, email, etc.) to any third party.